
What Is the NAAC SSR Report and Why It Matters
The Self‑Study Report (SSR) is the backbone of NAAC accreditation and presents a structured, five‑year picture of your institution’s quality under NAAC’s criteria. It combines quantitative metrics (QnM) and qualitative metrics (QlM) with evidence that NAAC uses for Binary accreditation, DVV, and MBGL decisions.
A strong SSR can lift your NAAC score and maturity level, while a poorly written one can drag you down even if your internal work is good. For most colleges, SSR preparation is the single most time‑consuming and risk‑prone part of NAAC—exactly where expert support makes the biggest difference.
Need Help with NAAC SSR 2026?
Get end‑to‑end NAAC SSR report writing support—from data templates and metric mapping to QlM drafting and DVV‑ready documentation. Bhavya Gyan Consultants works with institutions across India to make NAAC SSR preparation structured, accurate and stress‑free.
NAAC SSR Report Format in 2026 (Structure & Components)
NAAC’s SSR format is based on the official manual for your institution type (affiliated college, autonomous, university, etc.) and is still organized around seven core criteria, even as NAAC operationally talks in terms of 10 key attributes.
1. Seven Criteria and Key Indicators
The SSR is divided into criteria, key indicators, and metrics (QnM and QlM) such as:
- Curricular Aspects (e.g., curriculum design, feedback, revision cycles)
- Teaching‑Learning and Evaluation (e.g., student profile, teaching methods, exam reforms)
- Research, Innovations and Extension (e.g., grants, publications, outreach activities)
- Infrastructure and Learning Resources (e.g., labs, library, ICT)
- Student Support and Progression (e.g., scholarships, placement, alumni)
- Governance, Leadership and Management (e.g., IQAC, policies, finance)
- Institutional Values and Best Practices (e.g., environment, inclusivity, best practices)
Within each criterion, SSR formats list metric IDs (like 3.1.1, 3.3.2) with prescribed data templates and expected supporting documents.
2. QnM vs QlM – Data vs Narrative
- Quantitative Metrics (QnM): Number‑based, filled in NAAC data templates and verified through DVV (e.g., “Number of research papers per teacher in UGC‑listed journals”).
- Qualitative Metrics (QlM): Narrative write‑ups (usually 500–1000 words) describing processes, policies, outcomes and best practices with embedded or linked evidence.
QnM mainly determine your numeric score and require precise data and templates, while QlM shape NAAC’s picture of your institutional culture and maturity.
3. Data Templates and Annexures
NAAC provides revised data templates for institutions to upload metric‑wise data in standard formats (usually Excel), which are then cross‑linked to the SSR. Institutions typically organize annexures and evidence folders criterion‑wise and metric‑wise to make DVV and peer‑team verification smooth.
Real example references:
- Delhi University and other accredited colleges publish complete SSRs on their websites, which show how they fill metrics, templates, and annexures in practice.
- Metric pages (like 3.1.1–3.5.2) of many colleges show exactly what data templates and supporting documents NAAC expects.
Step‑by‑Step NAAC SSR Report Writing Process
Step 1 – Collect and Clean Five‑Year Data
Start by collecting five‑years’ data (academic, administrative, financial, research, extension, student outcomes) from all departments and cells. Clean the data for consistency (same year ranges, same program names, no double counting) and map it to NAAC’s data templates and metric IDs.
Step 2 – Map Metrics to Owners and Evidence
Assign each metric to a responsible owner (HoD, IQAC coordinator, librarian, exam cell, etc.) and clearly list expected proofs and templates. Use NAAC’s revised templates and example SSRs from accredited colleges as references for how data is structured.
Step 3 – Draft QnM Sections (Number‑Based)
Fill QnM templates first, because they determine your quantitative scores and directly feed DVV. Ensure that numbers reported in SSR, data templates, and attached documents (minutes, registers, result sheets) all align.
Step 4 – Draft QlM Write‑ups (Narrative‑Based)
QlM answers should follow a concise, evidence‑rich structure—context, process, outcomes, evidence.
A simple pattern:
- Context/problem
- Policy or system introduced
- Implementation process (who, how, frequency)
- Outcomes with data or examples
- Evidence references (reports, links, photos)
SSR templates and training documents show typical QlM lengths and tone, which are descriptive but focused, not promotional.
Step 5 – Link Evidence and Prepare DVV‑Ready Files
For each metric, create a named folder with properly titled, dated files; follow NAAC’s guidance on file naming, compression, and hyperlinking. Many successful institutions maintain separate “DVV proof” folders that mirror the SSR structure so any DVV query can be answered quickly.
Step 6 – Internal Peer Review and Mock DVV
Before submission, have an internal peer team (or an external NAAC consultant) review SSR entries, verify numbers, and simulate DVV questions. Colleges that treat SSR as an internal audit tool rather than a one‑time report usually get better NAAC grades and fewer DVV issues.
Practical SSR Writing Tips (That NAAC Peer Teams Actually Appreciate)
Tip 1 – Follow “Metric Language” Closely
Use the same vocabulary as the metric and manual (e.g., “ecosystem for innovations”, “extension and outreach programmes”, “outcome‑based education”) and answer exactly what the metric asks. This helps DVV partners and peer teams immediately see alignment without hunting for information.
Tip 2 – Use Data‑Backed Narratives, Not Slogans
Replace vague statements like “many seminars were conducted” with precise numbers and timelines (“16 seminars on IPR and entrepreneurship from 2021–2025, with 1,120 student participants”). Real examples published in SSRs show that NAAC values trends, averages, and ratios more than one‑off events.
Tip 3 – Show Trends Over the Last Five Years
Wherever possible, show trends (year‑wise tables, graphs) for admissions, results, placements, research output, outreach, and financial support. NAAC manuals and templates explicitly ask for year‑wise figures because improvement over time is central to accreditation.
Tip 4 – Keep QlM Focused and Evidence‑Oriented
QlM answers should not become mini‑prospectuses; they must stay within word limits and point explicitly to evidence (“as per Placement Cell report 2023–24, Annexure 5.2.1”). SSR samples from A/A++ colleges clearly show tight, factual writing with minimal marketing language.
Tip 5 – Use Standardized Formats and Templates
Many colleges publish their own SSR data templates and checklists online, which you can adapt to your context. Using consistent table formats across the entire SSR makes DVV and peer‑team reading much easier and reduces misinterpretation.
Real‑World SSR Examples You Can Learn From
Several accredited institutions publicly host their complete SSRs, including data templates and annexures, which serve as excellent learning references.
Examples you can study:
- Universities and colleges that have achieved A/A++ grades often share full SSR PDFs with criterion‑wise data, QlM narratives, and best practices sections.
- Department‑level SSR pages show how each metric (e.g., research grants, community outreach, MoUs) is represented with templates and supporting documents.
Use these as structural and stylistic references, not for copy‑pasting text, since NAAC expects institution‑specific, original data and narratives.
How Bhavya Gyan Consultants Makes NAAC SSR Report Writing Easy
As a pan‑India NAAC consultancy, Bhavya Gyan Consultants specializes in turning complex SSR work into a clear, managed process for colleges and universities.
What we typically do for SSR projects
- SSR planning workshop and 5‑year data audit for all NAAC criteria.
- Metric‑wise templates, owner mapping, and evidence checklist aligned with NAAC data formats.
- QnM calculation support and cross‑verification against institutional records.
- QlM drafting, editing, and polishing in NAAC‑friendly narrative style.
- DVV‑proof folder structure, file naming strategy, and sample DVV replies.
- Internal mock DVV and SSR peer review before final submission.
Ready to Turn Your Data into a NAAC‑Ready SSR?
Share your institution type and NAAC cycle, and Bhavya Gyan Consultants will design a customized SSR roadmap with clear timelines, responsibilities and expected outcomes. From first‑time accreditation to grade improvement, we help you build a strong, evidence‑backed Self‑Study Report.
FAQs:
The Self-Study Report (SSR) is the core document submitted to NAAC by colleges and universities seeking accreditation or re-accreditation. It presents a structured, five-year view of the institution’s performance under NAAC’s criteria, using both quantitative and qualitative metrics, along with evidence. Any institution applying for NAAC accreditation in 2026 must prepare and submit an SSR in the format prescribed in the latest NAAC manual.
The NAAC SSR is structured around seven main criteria such as curricular aspects, teaching-learning and evaluation, research and extension, infrastructure, student support, governance, and institutional values. Each criterion is broken into key indicators and metric IDs, which are categorized as quantitative metrics (QnM) and qualitative metrics (QlM). Institutions provide data for QnM in standard templates and write structured narratives for QlM, supported by documentary evidence.
Quantitative Metrics, or QnM, are number-based metrics such as student enrollments, pass percentages, research publications, grants and outreach counts. These are filled in NAAC data templates and validated in the DVV process. Qualitative Metrics, or QlM, require descriptive write-ups that explain the institution’s policies, processes, best practices, and outcomes. QlM focuses on how things are done and how they impact stakeholders, supported by relevant evidence.
Colleges should begin by collecting five years of data from all departments and cells, including academics, examination, research, placement, accounts, and student support. The data must then be cleaned for consistency and entered into NAAC’s revised data templates metric-wise. A clear folder structure, with criterion-wise and metric-wise evidence, and standard file naming conventions, makes it easier to fill the SSR, respond to DVV queries and face peer team visits.
Effective QlM answers are concise, structured and evidence-based. A common approach is to describe the context, the policy or practice, the implementation process, and the measurable outcomes, followed by explicit reference to annexures. Institutions should avoid promotional language, stick to the word limits suggested by NAAC, and ensure every claim is backed by verifiable documents such as minutes, reports, photos or URLs.
Yes. Many private and unaided colleges partner with specialized NAAC consultancy firms to plan and prepare their SSR. A consultancy like Bhavya Gyan Consultants can support institutions with metric-wise templates, data validation, QlM drafting, DVV-proof documentation and internal peer reviews, helping them save time, reduce errors and improve the quality of their Self-Study Report.
Related Links:
Latest Posts
- How to Get NAAC Accreditation: A Step-by-Step Strategic Roadmap for Higher Education Institutions
- Cost-Effective Subscription Strategies for Tier-3 Higher Education Institutes: A Practical Guide to Affordable College Journals
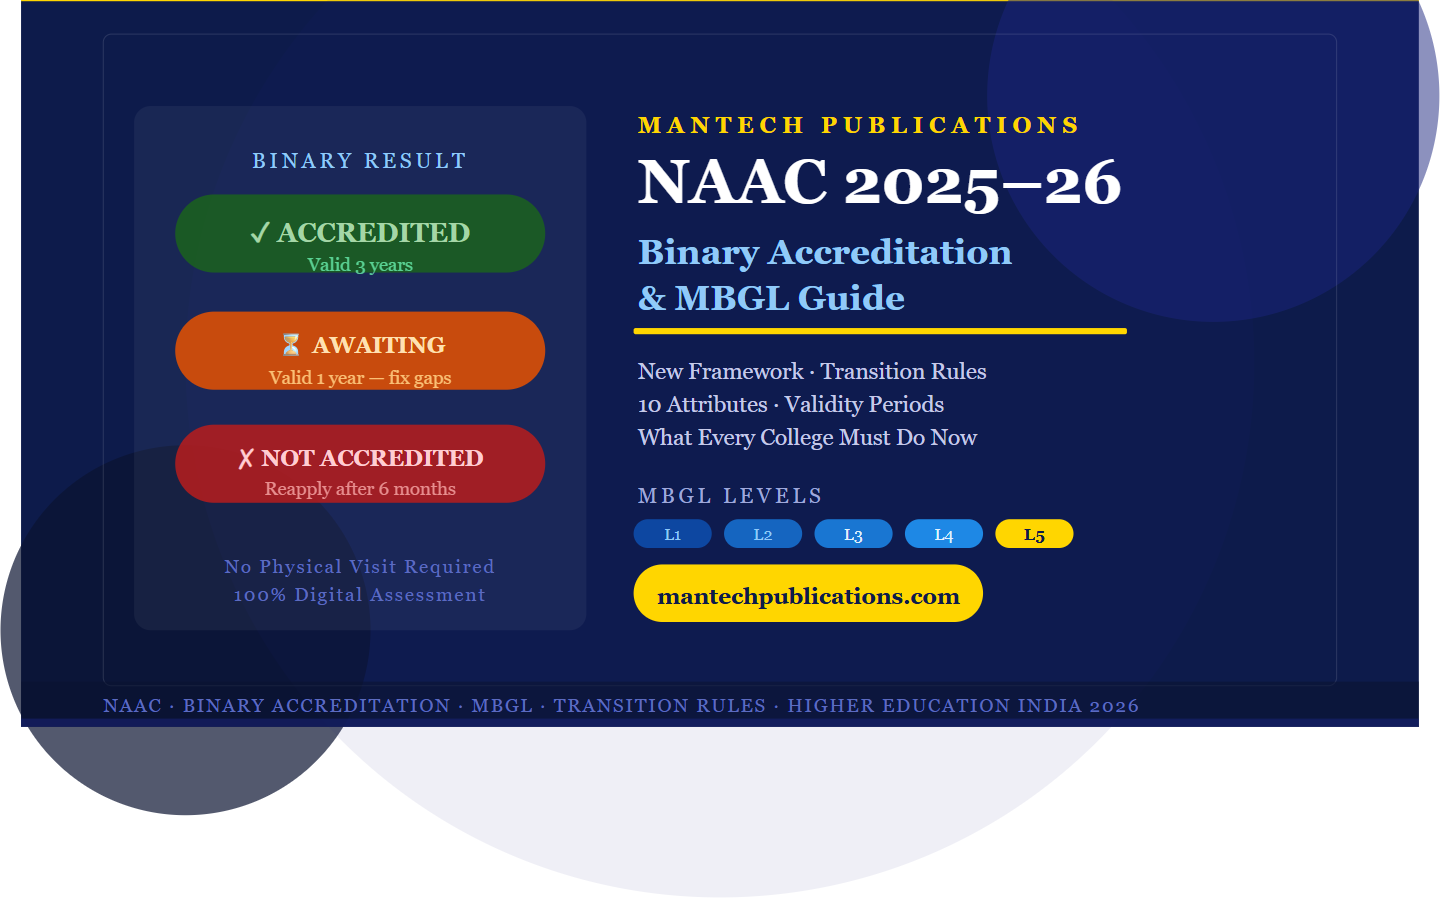
- NAAC New Accreditation System 2025–26: Binary Accreditation, MBGL Levels, and What Every Indian College Must Know
- Redefining the Digital Spine: An Ergonomic Blueprint for the Modern Human
- Best NAAC Consultancy Services in India: How to Choose the Right Partner
Related posts:
![How to get NAAC Accreditation 2026]()
How to Get NAAC Accreditation: A Step-by-Step Strategic Roadmap for Higher Education Institutions
![Affordable college journals]()
Cost-Effective Subscription Strategies for Tier-3 Higher Education Institutes: A Practical Guide to …
![NAAC-New-Accreditation-System-2025–26 by mantech Publications]()
NAAC New Accreditation System 2025–26: Binary Accreditation, MBGL Levels, and What Every Indian Coll…
![Mantech-Publications-Journals Best NAAC Consultancy Services in India by Mantech Publications]()
Best NAAC Consultancy Services in India: How to Choose the Right Partner
![Naac grades are expiring-what to do by Mantech Publications]()
Why Colleges Fail in NAAC Accreditation Even After Good Work
![NAAC Accreditation 2026]()
NAAC Accreditation 2026: Complete Step‑by‑Step Guide for Colleges (with New 10 Criteria)


Leave a Reply